
James App for People with Parkinson’s

James is a B2B2C system meant for doctors, neurologists, People with Parkinson’s (PwP), and their caregivers to analyse and monitor Parkinson’s symptoms, and keep track of their health and medication and adjust medication remotely. The system is made up of a doctor’s dashboard, a patient’s app, and a FitBit Ionic app.
I was in-charge of branding, ideation, design, prototype, UX research, user interviews and usability studies. On occasion, I would participate in and/or observe data collection and clinical trials. I worked closely with local developers, the research team in Germany, the doctor’s assistant in National Neuroscience Institute (NNI) - I created documents and organised meetings regularly to keep all teams up to date on progress, aligned on product vision and any changes. NNI is also our official clinical study and research partner.

What is James trying to solve?
For Doctors:
Only meet their patients twice a year for less than 15 minutes per visit - receives a snapshot of the patient’s progress.
Unable to adjust medication to respond to patient’s symptoms till date of check-up, resulting in patients tinkering with their own doses.
Unable to get objective input on their patient’s health, have to rely on patient recount
For People with Parkinson’s (PwP’s):
Unable to report their medication intake accurately
Unable to adjust their medications according to their symptoms
Unable to report their progress properly, unsure what information is important

How does James work?
James is a system that comprises of 3 parts that work together to allow both doctors and patients a more comprehensive and objective overview of their health. Having a system also means being able to monitor, modify, and receive updates without having to go down to the hospital.
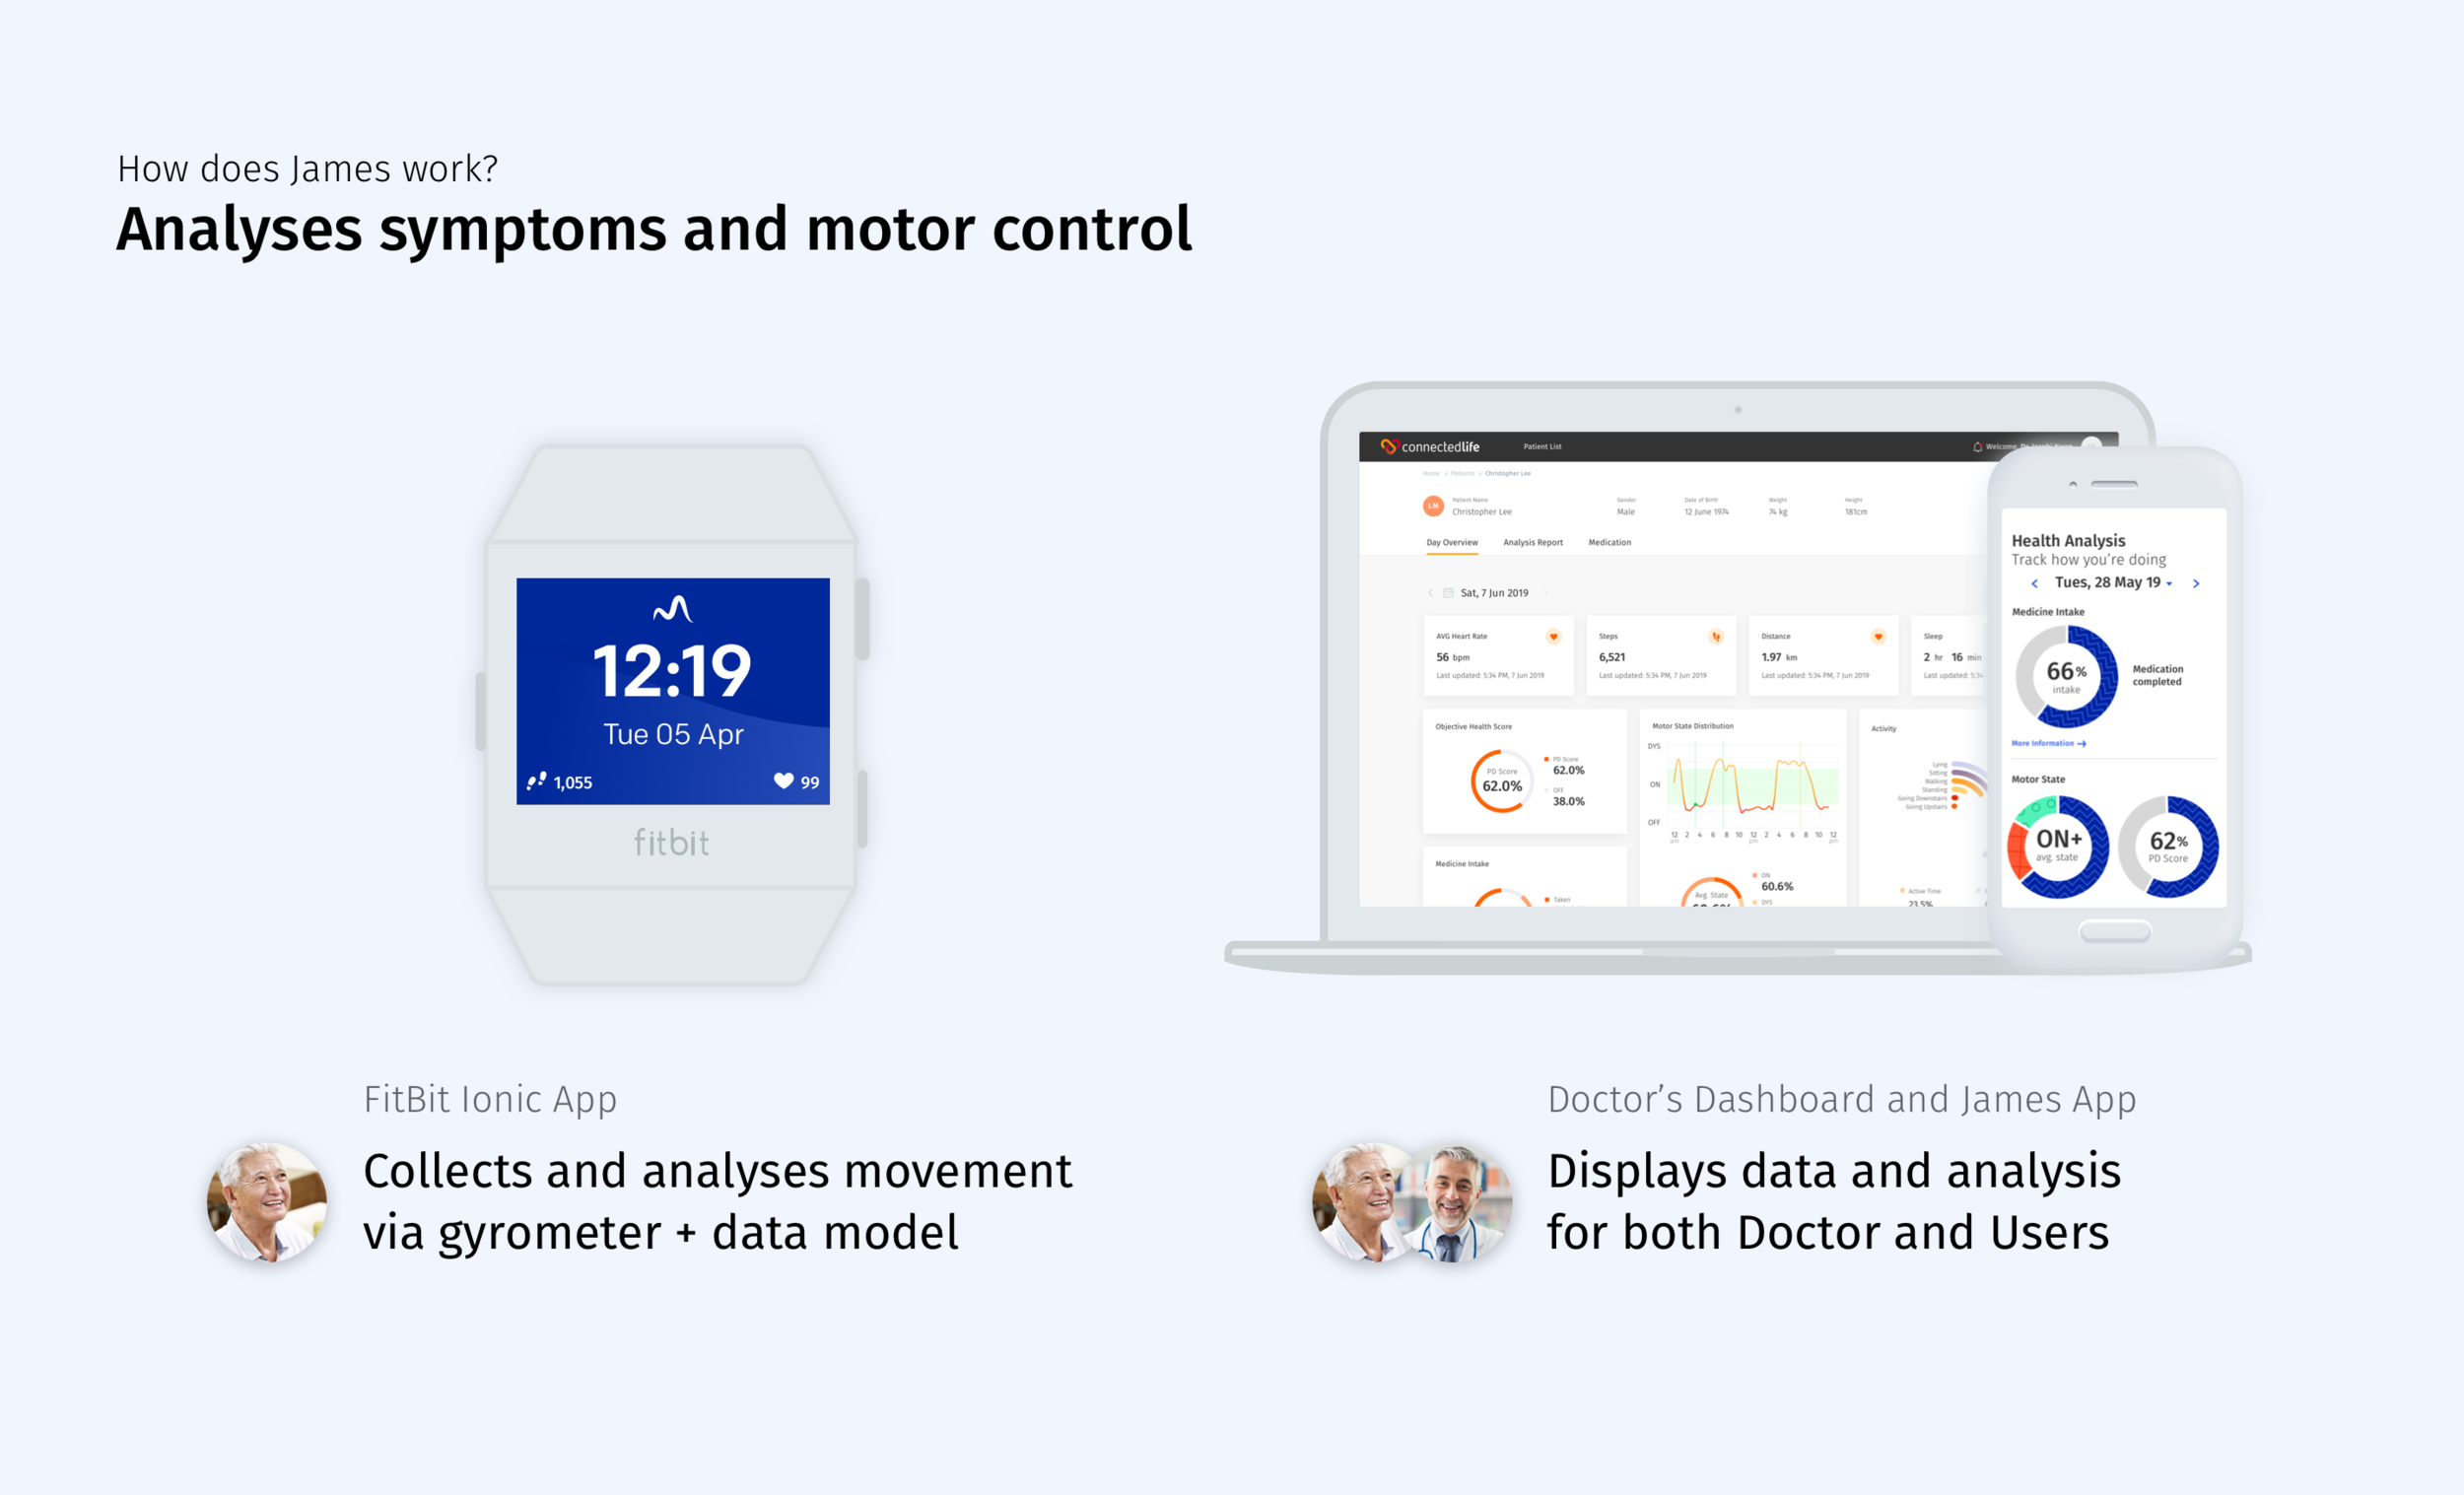


Doctor’s Dashboard

User’s App and FitBit

Process
The original idea was for James to be a personalised concierge for People with Parkinson’s. The app would remind users when to take their medication, plan their activities for them, remind them to drink water, and meet up with friends and family - all these aspects play a part in managing one’s health with Parkinson’s Disease (PD). The vision for the app was conceived in Germany, where our medical research team is.
When I first took over the project, an existing version of the app was already in production. A style guide was also created by a previous designer but had not been properly communicated to Germany and the production team then.
Research Process
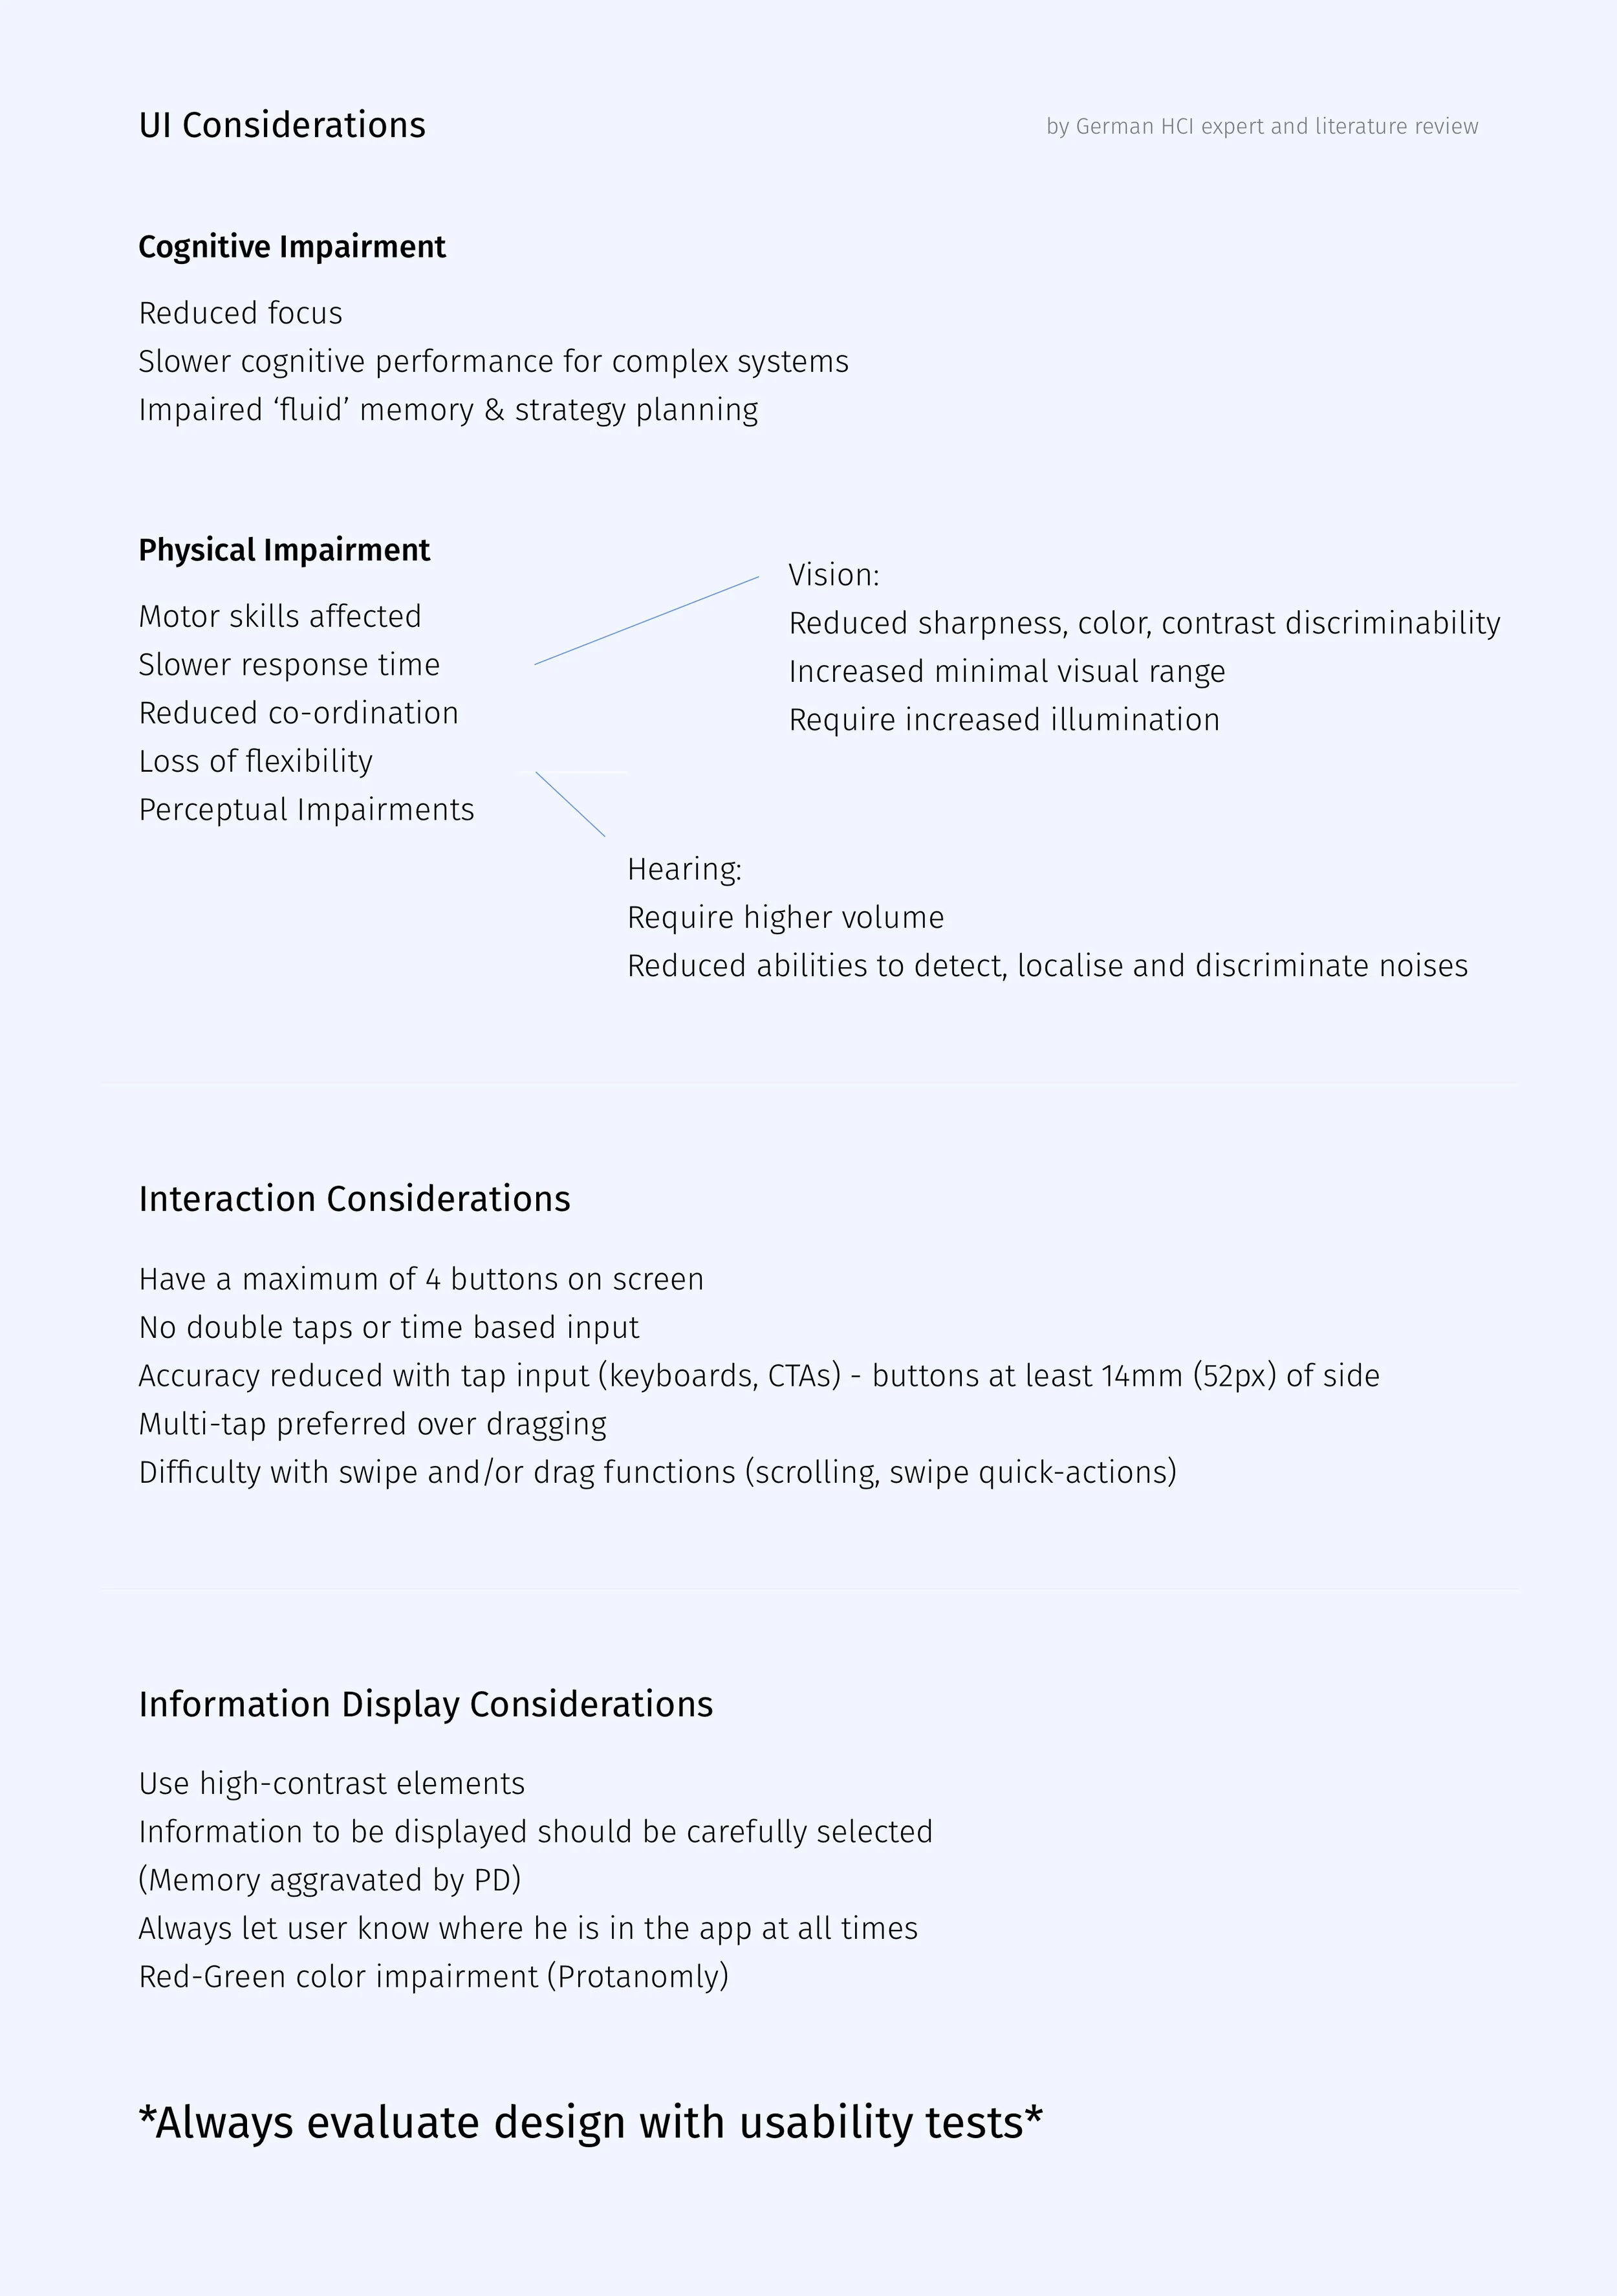
To start the project, I did a literature review of designing for people with motor disability, read medical research papers sent from Germany, and had people speak to German HCI experts to better understand my target audience.
A heuristics evaluation was conducted on the existing app and my suggestions and findings were shared with both the team in Germany and Singapore.


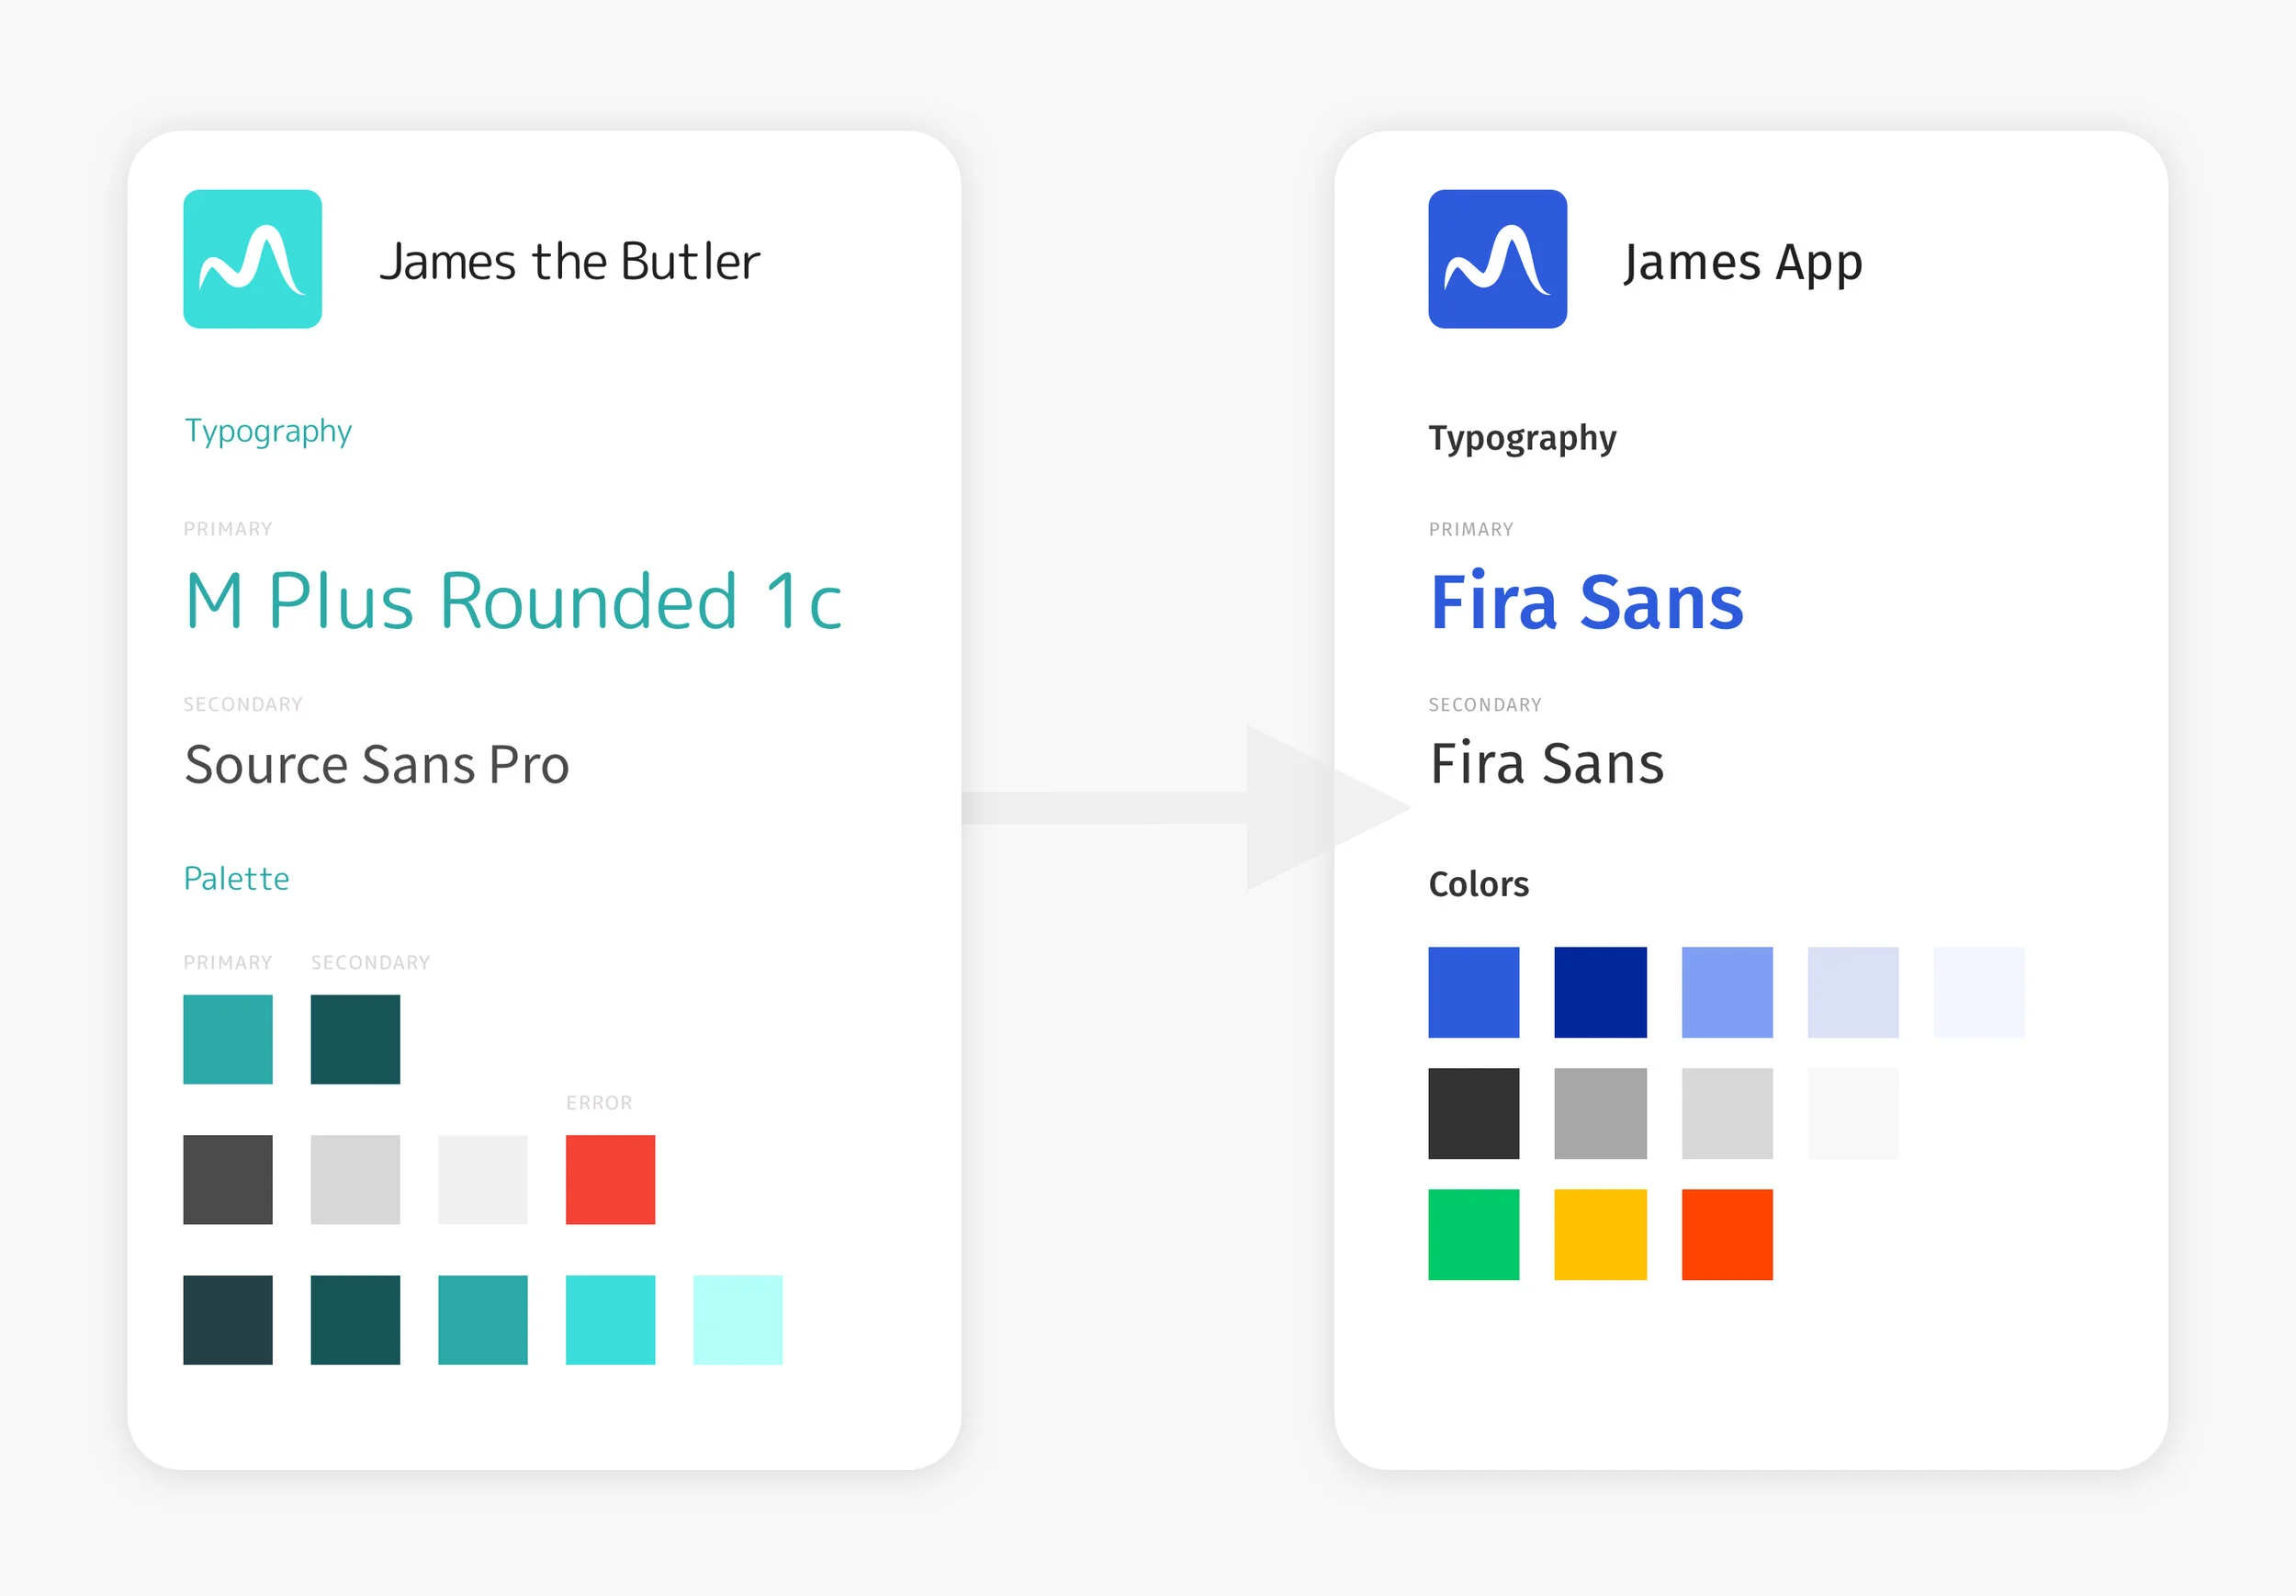
Redesigning the app
As the design system had just been established, I used it as a reference and re-designed the style guide to tie it closer to the ConnectedLife branding. Instead of introducing another font into the app, I used the ConnectedLife main font, Fira Sans, and enlarged it by 2 points for better readability for our specific users.
This redesign aimed to be easier to use and manage, had clearer terms, and made inputs easier as compared to the previous version.


During the time we were discussing the app, a hiccup with the development team in Kochi (India) ran into some trouble, resulting in the loss of the app’s code. Instead of rebuilding the previous app with all the functions, our product team sat down with the Germany research team and discussed which of these functions would make a Minimum Viable Product (MVP).
Minimum Viable Product
However, during the time we were going through the re-designs, a hiccup with the development team in India resulted in a the loss of the app’s code. Instead of rebuilding, our product and research team sat down together to discuss which of these functions would make for a Minimum Viable Product (MVP).
We decided that the motor state monitoring and medication would be the key functions that made the MVP. Activity, appointment and water reminders were important too, but added a lot of bulk into the app, and were not core to the primary focus of the app - to help doctors get a more holistic view of the user’s health.
During this round of design, I managed to convince stakeholders to reconsider the main color of the app as colour-blindness could easily be accommodated for with blue.
Methodology
Medical regulations meant acquiring users would take an extended period of time, we decided to prototype an app that the product and research team believed was the MVP before gathering users from various legal and ethical channels. We also maximised our time with each user by having both usability and user interviews together.
The usability study aimed to get feedback on the redesigned app while the user interviews aimed to get qualitative feedback
As our system requires users to interact with either an app or FitBit (which screen is relatively small), it would only be suitable for users who are in their early stages to mid stages of Parkinson’s. At the moment, users who are scheduled for Deep Brain Simulation (DBS) Surgery, or are in their late stages are not our intended target.
We identified our primary user to be Motivated Mel, a young mother in her mid 40s with early stage Parkinson’s. Usually, older adults (above 60) get diagnosed with Parkinson’s. It is rare for an individual to be diagnosed any younger than that, but not unlikely.
However, as most of our users are sent from NNI x ConnectedLife’s clinical trial/data collection protocol, and will eventually be our first market on release of the app, we identified another primary user, Ah Seng, a retiree in his 70s.


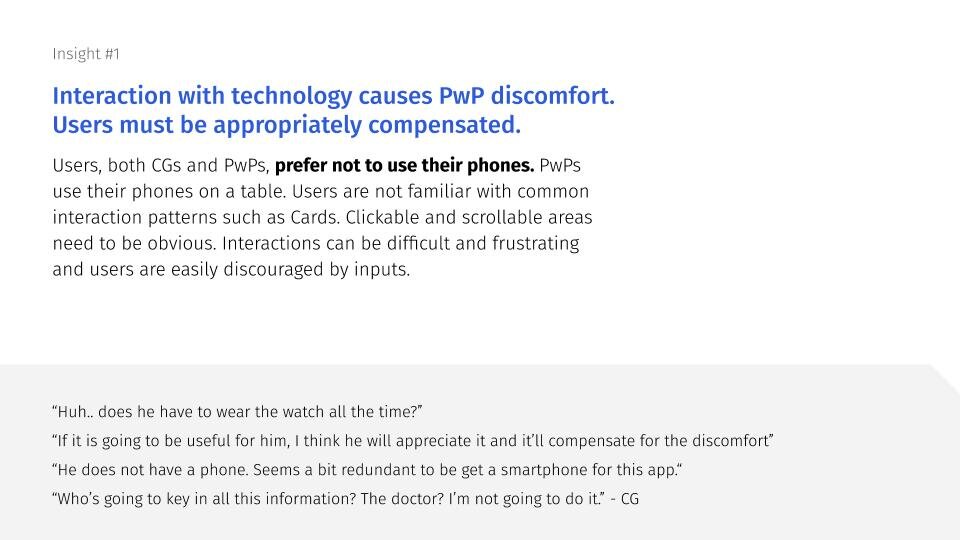
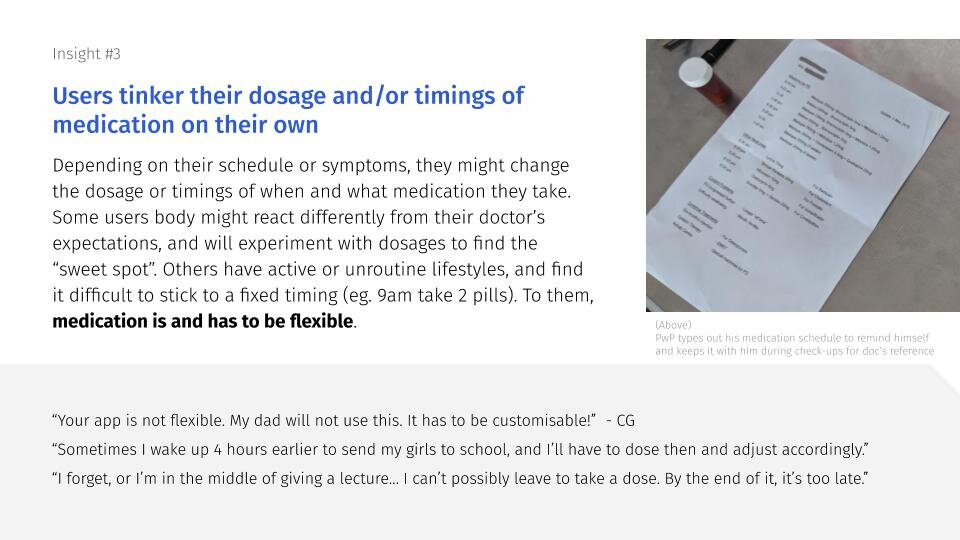
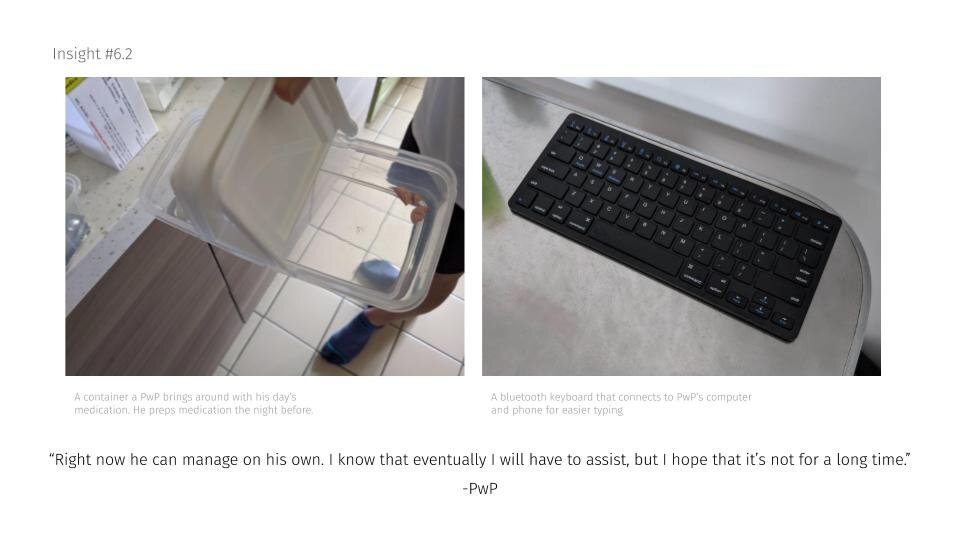
Insights

Next Steps
In the next steps, we will work on integrating activity and water reminders. Physical activity and drinking plenty of water have proven to help PwP cope with their symptoms better, and users have given feedback that such reminders will help them take a load off their mind.
More effort will be focussed on re-thinking the analysis page for the user’s app to make it more human centric. While charts and numbers can be helpful to doctors, it has proven overwhelming to users. The data should still be available for the minority of users who use self-quantification to cope with their PD, but for the majority of users, the information should be more actionable. More research and discussion needs to be had with the Germany team for this.


